Materials and methods |
|
The E. coli Promoter collection [5] is delivered in 21 separate 96 well plates. Each well contains a strain stored in glycerol with a different promoter upstream of a Green Fluorecent Protein(GFP) coding sequence. We used our custom 96 Well Plate Replicator to replicate the plates AZ_01 to AZ_05 of the promoter collection (a complete list of the library as well as the content of individual wells can be found here). We also prepared a plate with curated candidate promoters known to be implicated in the stress response, Redox sensing, Amino Acid synthesis and Ion Channel production in E. coli. Cells were grown overnight in M9 minimal media (0.4% Glucose, no amino acids). this media was used to limit intefering substances found in rich media. In the morning the cells were diluted 1:100 in 96well plates with fresh media We based our chosen electroshock amplitudes on those of a precedent paper [13] which produced different dynamics of membrane potential changes. 1 volt showed a strong un-sustained hyperpolarisation of the membrane, while 3 volts produced a less strong, sustained hyperpolarisation of the membrane. Initial ScreeningWe used the High throughput Electro Actuator (HTEA) in conjunction with the AC Dispatcher (ACD) and the Electro Planner to shock the bacteria with AC current in 3 different conditions:
|
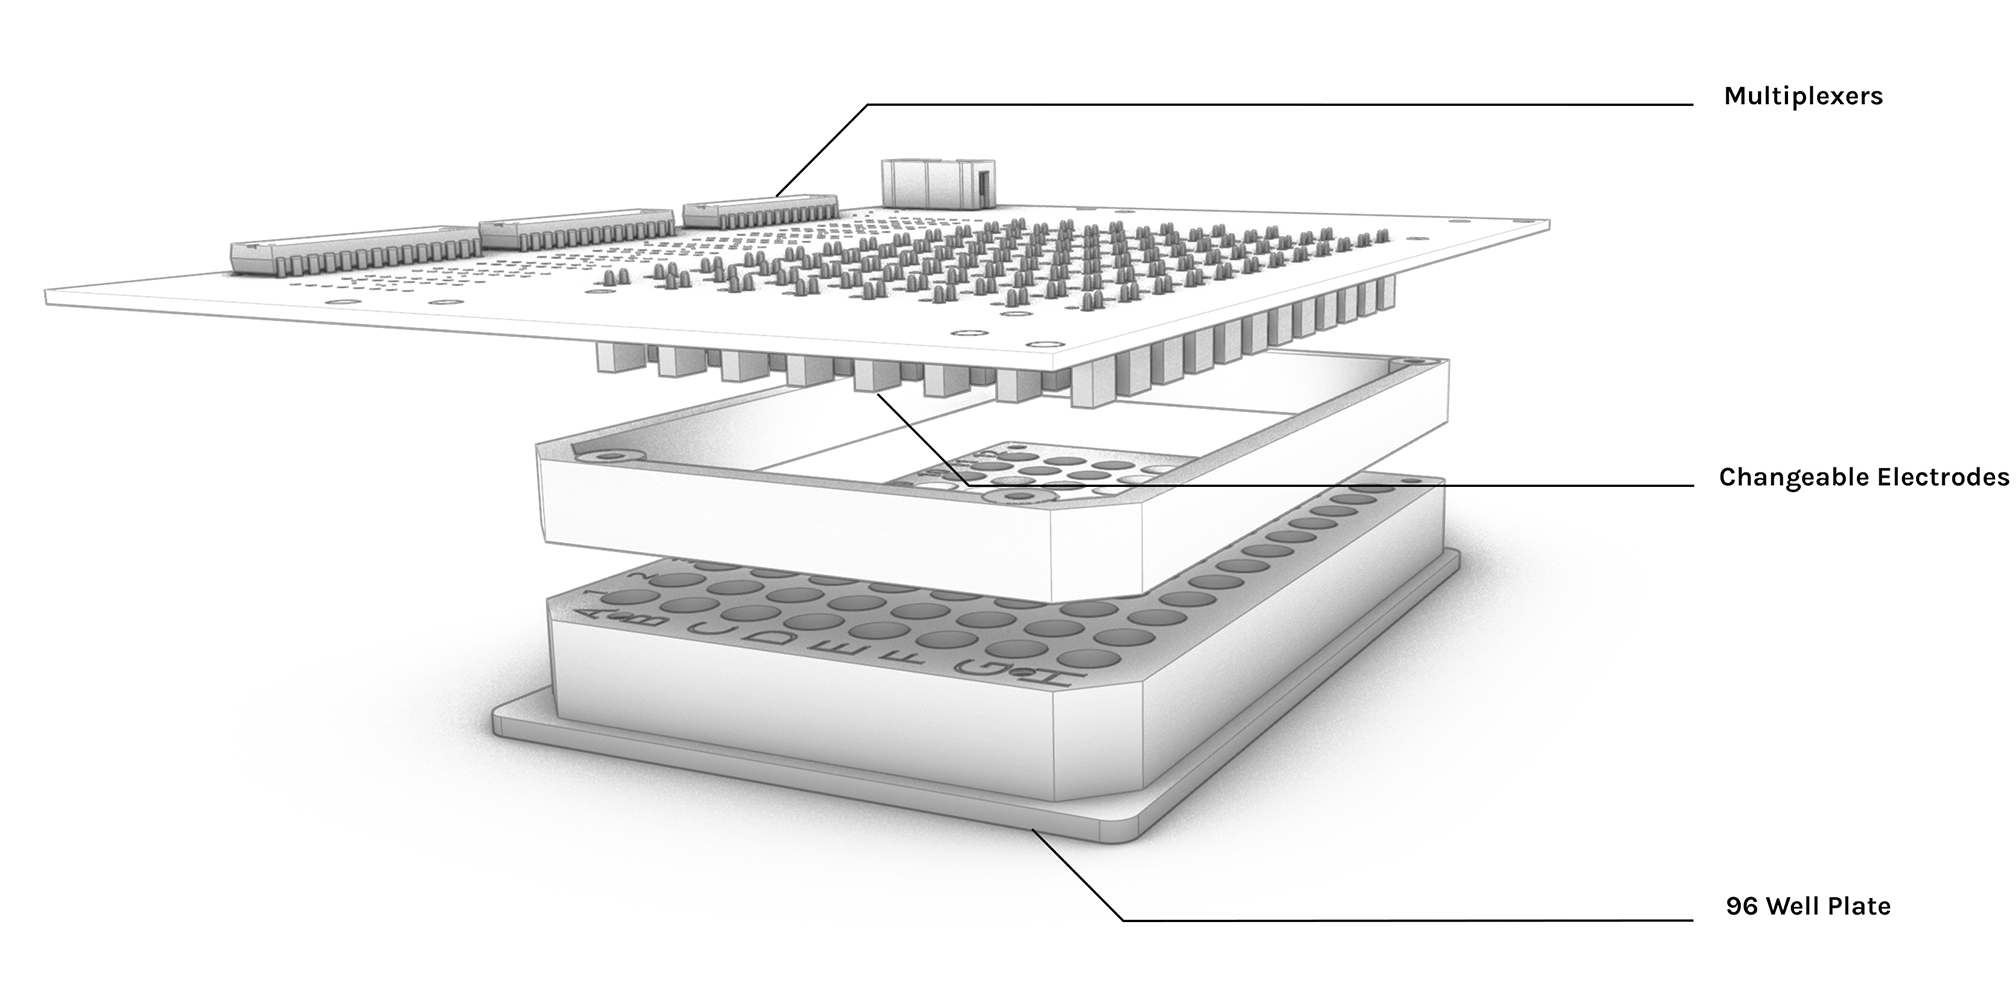
High throughput Electro Actuator (HTEA)
