Modeling
The focus of our work was to better understand the kinetics of the sensing and the variations in the current output
due to the lncRNA detection. In this perspective we have chosen to focus on two main steps of the process: the
expression of the cytochrome A with the toehold switch and the electron transfer from the metabolism of the bacteria
to the cathode. We have chosen these steps since they have been identified as the main bottleneck reactions and
provide a good overview of the sensor’s general functioning.
All the code for this part can be found in the team’s GitLab repository.
Modeling the toehold switch
Toehold switches are synthetic constructions that can be used to simulate the behavior of mRNAs, lncRNAs, and miRNAs delivering information from DNA to the protein-synthesizing machinery. In our project, we utilize a toehold switch containing a recognition site for the cancer biomarker PANTR1 lncRNA. This biomarker is in charge of stimulating the ribosomes to initiate transcription of downstream genes, as is shown in Figure 1.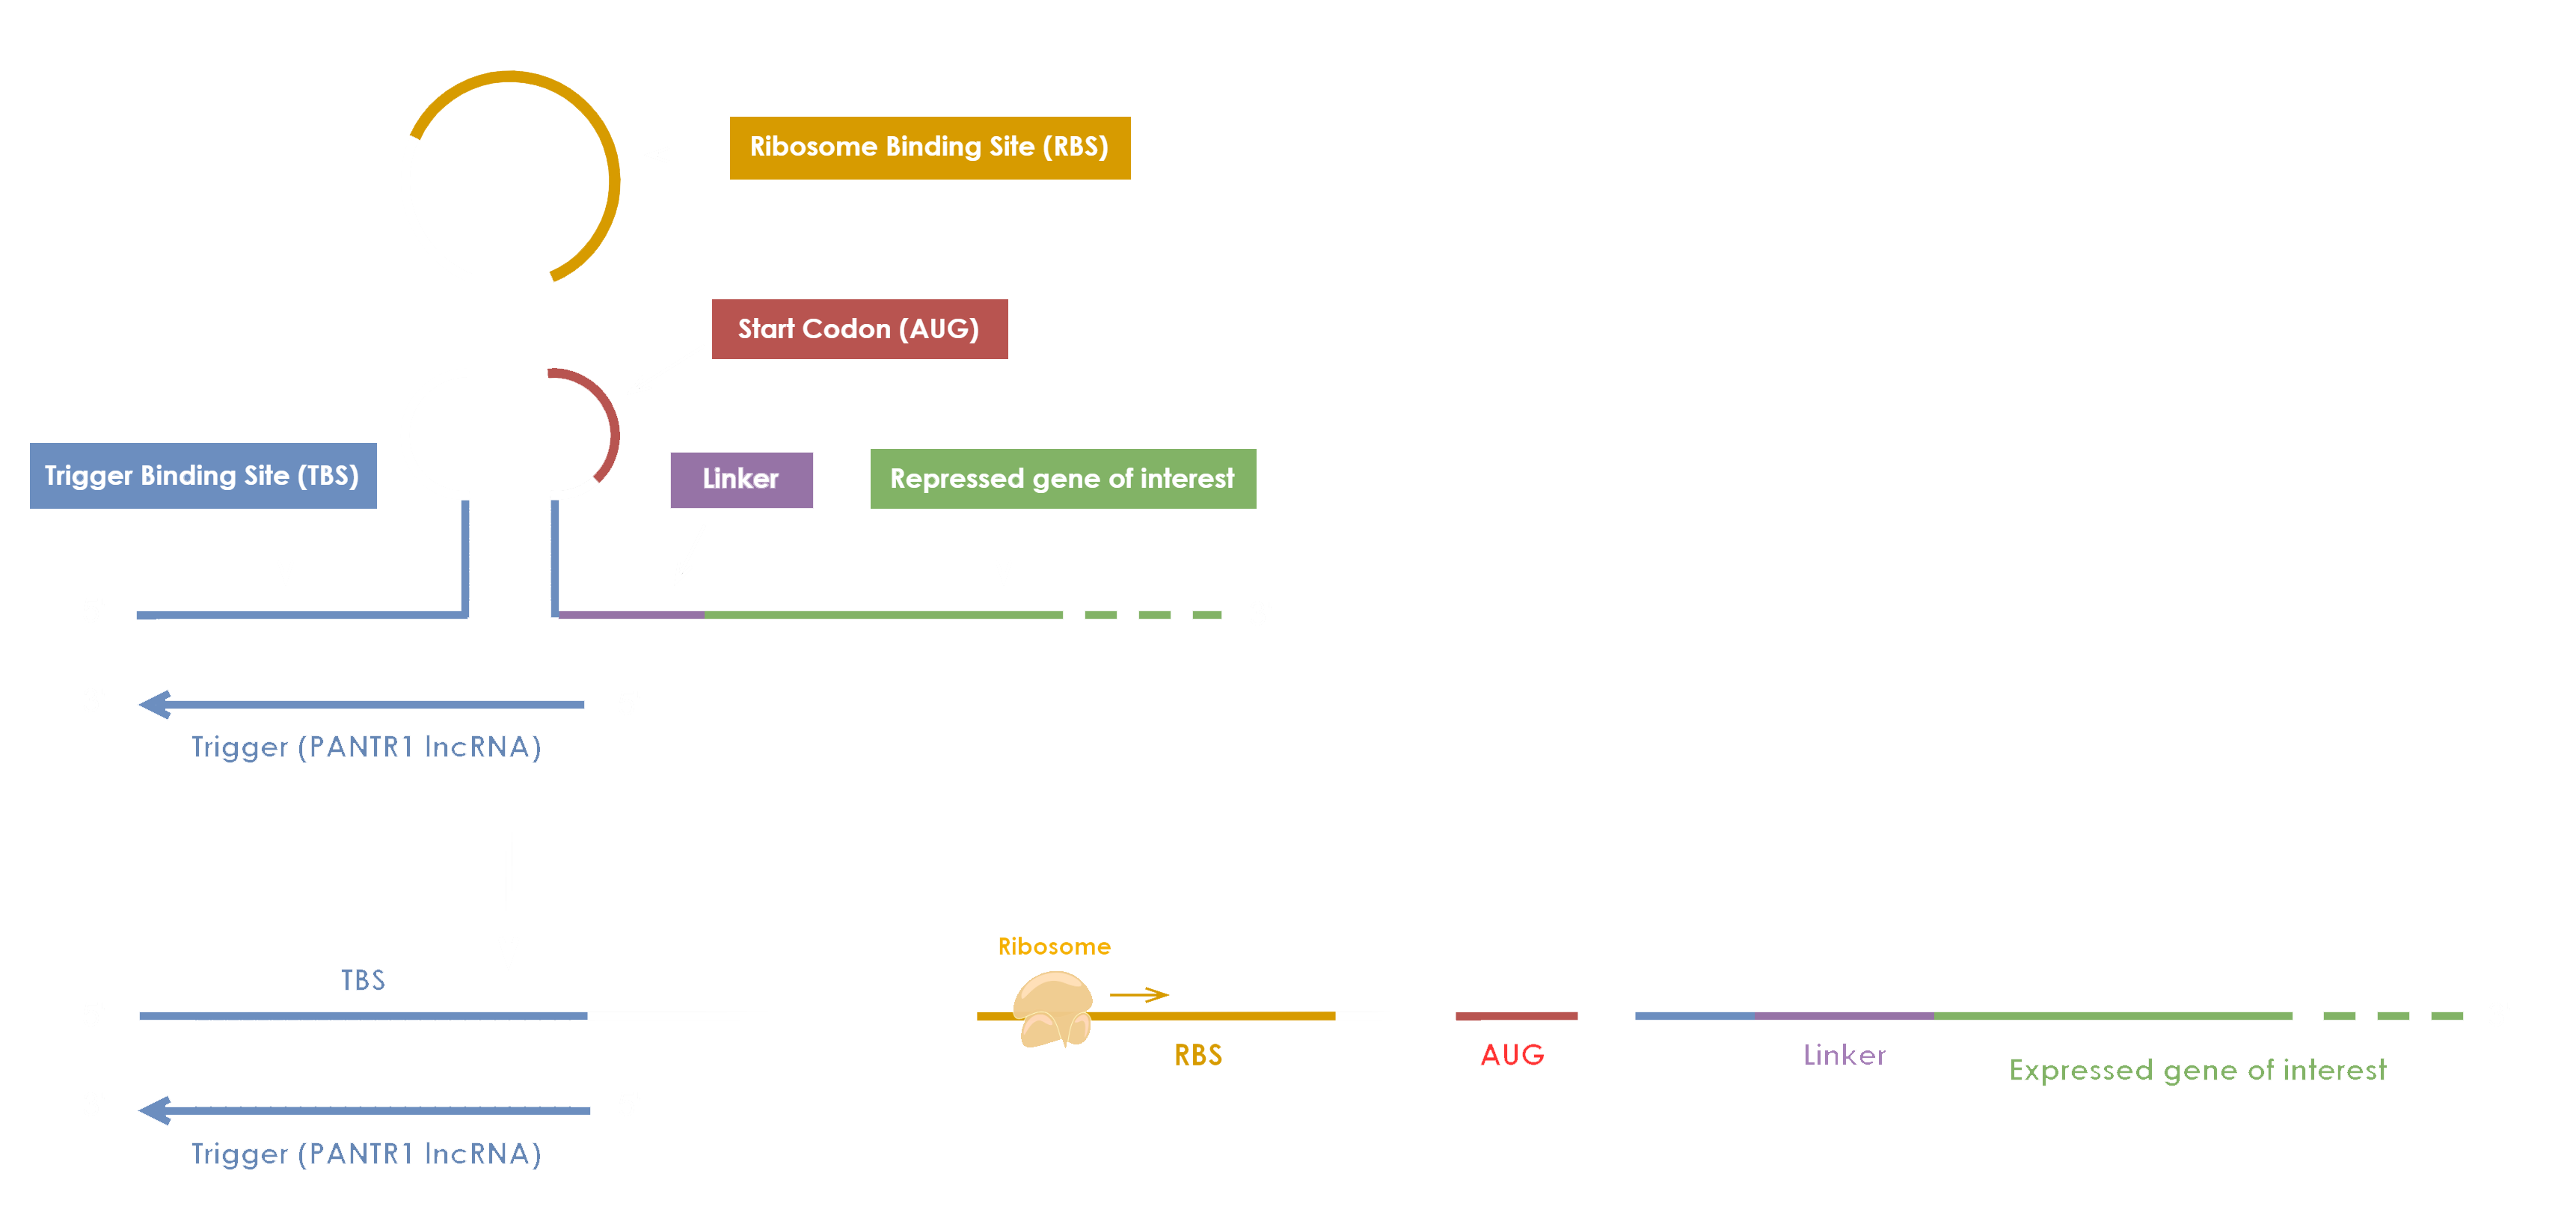
For the modeling part of our project, we have employed the modeling strategy used by the SASTRA iGEM 2019 team (SASTRA iGEM 2019 Team · GitHub). We have used a similar modelling approach to explore the levels of expression of the GFP protein in our engineered toehold switch containing the PANTR1 lncRNA switch (Figure 2). Moreover, we have writen a python implementation of the modelling approach which can be found in the following link.
The python implementation helped us make the code more accessible, as python is freely accessible as opposed to matlab, and also allowed us to make modifications and adjustements to better fit the scope of our project.
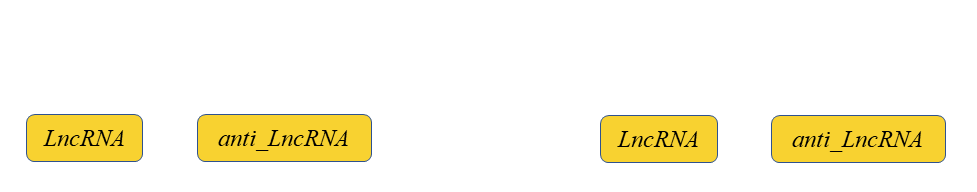

The chemical and biochemical kinetics model takes into account the transcribed lncRNA and anti-lnc (trigger sequence displayed in Figure 1) oligs to form a lncRNA - antilncRNA with two free ends which then is attached to the toehold switch and the maturation kinetics of the expressed GFP [1]. Thus, the model can be represented qualitative by the diagram of the Figure 2, and quantitative by the corresponding ODEs:
Where CTS and OTS stands for Close Toehold Switch and Open Toehold Switch respectively.
To determine the decay rate of the lncRNA we assumed that its concentration rate is directly proportional to its concentration, and the constant of proportionality is determined by the decay rate kdecay. This relation is described by the following equation:
The minus symbol indicates that the lncRNA is being degraded. Solving this equation for C, we find:
where [lncRNA]0 is the initial concentration of the lncRNA, before decay starts.
Based on literature, we found that the half-life (t1/2) of lncRNAs is around 17.46 ± 3.0 h [2]. Applying the equation above we obtain:
ln1 ∕ 2 = −kdecayt1∕2 (10)
from where:
kdecay = ln2 ∕ t1∕2 (11)
Where we obtained a value for kdecay of 0.000011 s-1 (verify).
Thus, by defining the parameters and solving the differential equation showed in (put the number of the equations) we could recreate the following graph:
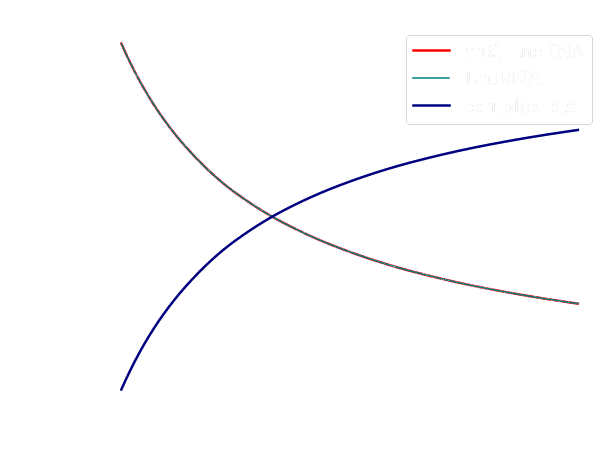
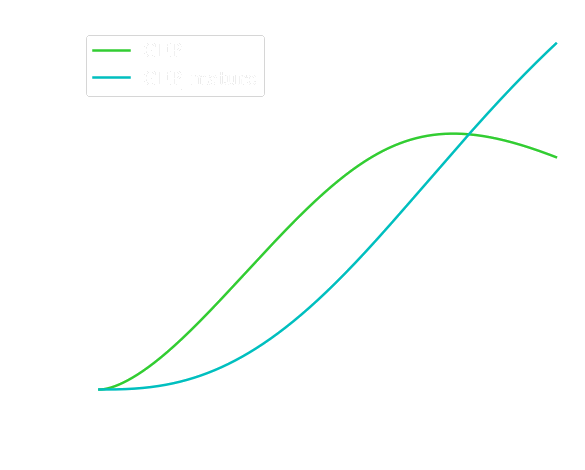
We observed from the curves displayed in Figure 3 (left) that the concentration of both lncRNA and anti-lncRNA are the same and decreases across time, while the concentration of the complex Close Toehold Switch (CTS) shows an increased monotonic behavior. From the curves shown in Figure 3 (right) we studied how the concentration of the Open Toehold Switch (OTS) increases across time, but it decreases slowly when the concentration level of the CTS increases. This observation is connected to the fact that once the toehold switch is open (OTS), it allows the transcription and translation of the GFP protein. Once the process is completed, the toehold switch comes back to its natural state (CTS). Indeed, we can observe in Figure 4, how the concentration of the GFP has a similar behavior with the OTS concentration throughout time. Moreover, we noted an expected lag between production of the GFP and its emission (GFP maturation) in Figure 4.
Modeling electron transfer
For this part we have adapted the model from the 2013 iGem Team Bielefeld project “Ecolectricity”. They developed a set of equations to model the general functioning of à Microbial Fuel Cell based on three phenomena:- the generation of NADH,H+ by the metabolic pathways of the bacteria
- the reduction of an oxidized mediator
- the transfer of the electrons from the reduced mediator to the electrode
Reducing power production
To ensure a functioning metabolism, the transfer of electrons in a cell is key because some molecules need to be oxidized, for example, to produce energy while others need to be reduced, for example to provide electrons to the enzymes of an electron transport chain. Thus, this requires electrons to be hosted in transfer molecules from the oxidation sites to the reduction ones. As glycolysis is the primary step of the main E. coli metabolic modes [3], we will make the assumption that it is also the main source of electrons. As there is only one reaction in the main path of glycolysis that produces electrons, we will focus on this one. The electrons are extracted in an oxido reduction reaction and then hosted in a reduced molecule, the nicotine adenine dinucleotides NADH,H+:
As the product of this reaction is then consumed by the following steps of the glycolysis, we can assume that the reverse rate is negligible. Thus, at steady state, the production of NADH,H+ can then be expressed with a Michaelis Menten equation of the enzyme’s kinetics [4]:
\(\frac{d[NADH,H^{+}]}{d t}=v_{\max } \frac{[NAD^{+}]}{k_m+[NAD^{+}]}\) (12)
\( \frac{d[NADH,H^{+}]}{d t}=k_{c a t} E_0 \frac{[NAD^{+}]}{k_m+[NAD^{+}]} \) (13)
Menaquinol reduction
Then, electrons cross the inner membrane of the cell by the oxidation of menaquinol into menaquinone thanks to the nanoconduct enzyme called cytochrome A. The latter has been expressed through the toehold switch mechanism explained previously. The reaction occurring is the following with Mox being the menaquinol and Mred the menaquinone :\(NADH,H^{+}+M_{ox} \rightarrow M_{\text {red}}+NAD^{+} \) (14)
The kinetic rate constant of this reaction has been measured by Zhao et al., 2003 [5] through a stopped flow method and the resulting k2 is 0.22 +/- 0.02 s(-1).
Menaquinone oxidation
Finally, the electrons are transferred from the reduced mediator to the anode through the following equation:\( M_{\text {red}} \leftrightarrow M_{ox}+2 H^{+}+2 e^{-} \) (15)
With the output rate being computed following the Faraday law [4]:
\( I=n F k_3\left[M_{red}\right] \) (16)
Where:
- I is the current density [A]
- [Mred] is the concentration of reduced mediator in the chamber
- n is the number of electrons taking part in the electrode reaction
- F is the Faradays constant (96 500 C)
- k3 is the reaction rate of the mediator oxidation at the anode
Results of the simulation
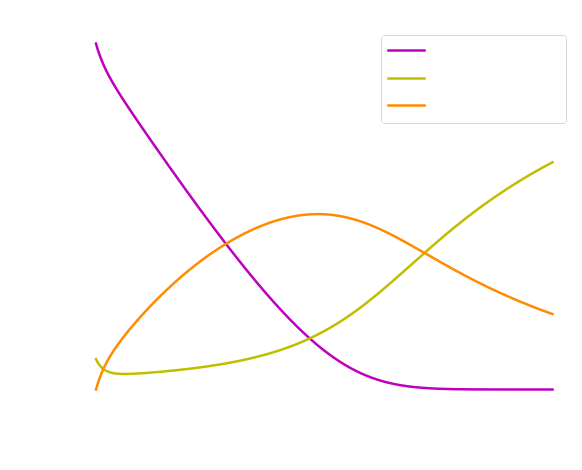
The curves describing the evolution of the concentration of the different reactives obtained are the following: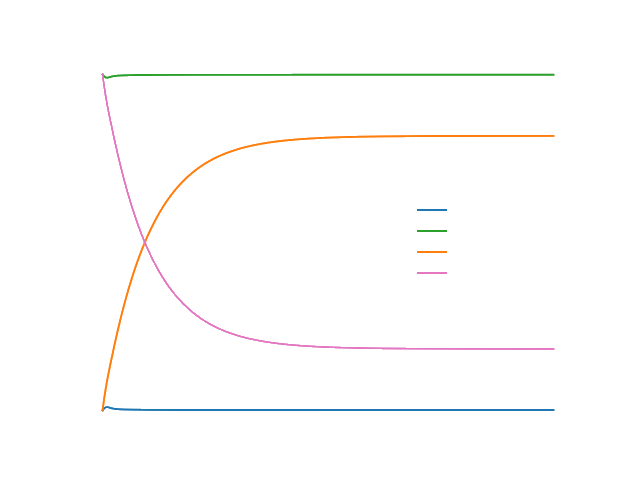
And the current output evolves as followed:
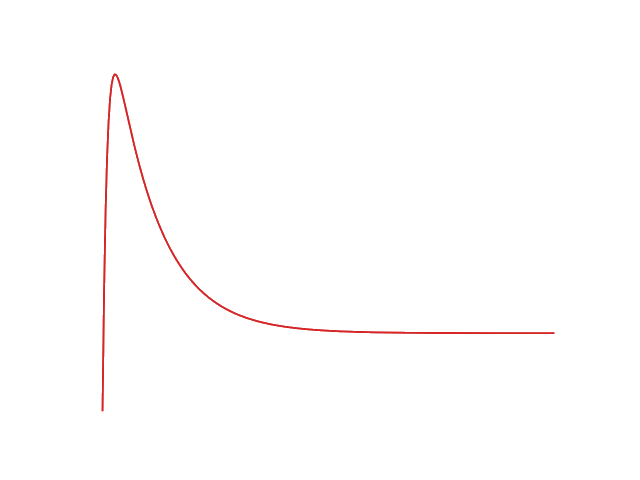
This data would allow us to better optimize the different detection parameters of the electronic system controlling the sensor such as the detection threshold or the time interval between two sensing sessions.
Conclusions of the modeling in general
The modeling approach and the results we obtained from the simulations allowed us to have a better understanding of the biochemical and biophysical phenomena occurring in our system. The framework developed enabled us to model our system testing different conditions. We could predict how the system behaves by changing different parameters of the equations (concentration, time, kinetic rates) and try to interpret the system's behavior. However, we encourage feature iGEM teams to use our model and test its predictions experimentally.References
[1] Baabu PRS, Srinivasan S, Nagarajan S, Muthamilselvan S, Selvi T, Suresh RR, Palaniappan A. End-to-end computational approach to the design of RNA biosensors for detecting miRNA biomarkers of cervical cancer. Synthetic and Systems Biotechnology (2022) 7: 802–814.[2] Wang C, Liu H. Factors influencing degradation kinetics of mRNAs and half-lives of microRNAs, circRNAs, lncRNAs in blood in vitro using quantitative PCR. Scientific Reports (2022) 12: 7259.
[3] Trotter EW, Rolfe MD, Hounslow AM, Craven CJ, Williamson MP, Sanguinetti G, Poole RK, Green J. Reprogramming of Escherichia coli K-12 metabolism during the initial phase of transition from an anaerobic to a micro-aerobic environment. PloS One (2011) 6: e25501.
[4] Bielefeld iGEM team, Modeling of Microbial Fuel Cell (2013).
[5] Zhao Z, Rothery RA, Weiner JH. Transient kinetic studies of heme reduction in Escherichia coli nitrate reductase A (NarGHI) by menaquinol. Biochemistry (2003) 42: 5403–5413.
[6] Bergsma J, Meihuizen KE, Van Oeveren W, Konings WN. Restoration of NADH,H+ oxidation with menaquinones and menaquinone analogues in membrane vesicles from the menaquinone-deficient Bacillus subtilis aroD. European Journal of Biochemistry (1982) 125: 651–657.