
Experiments
Experimental Design
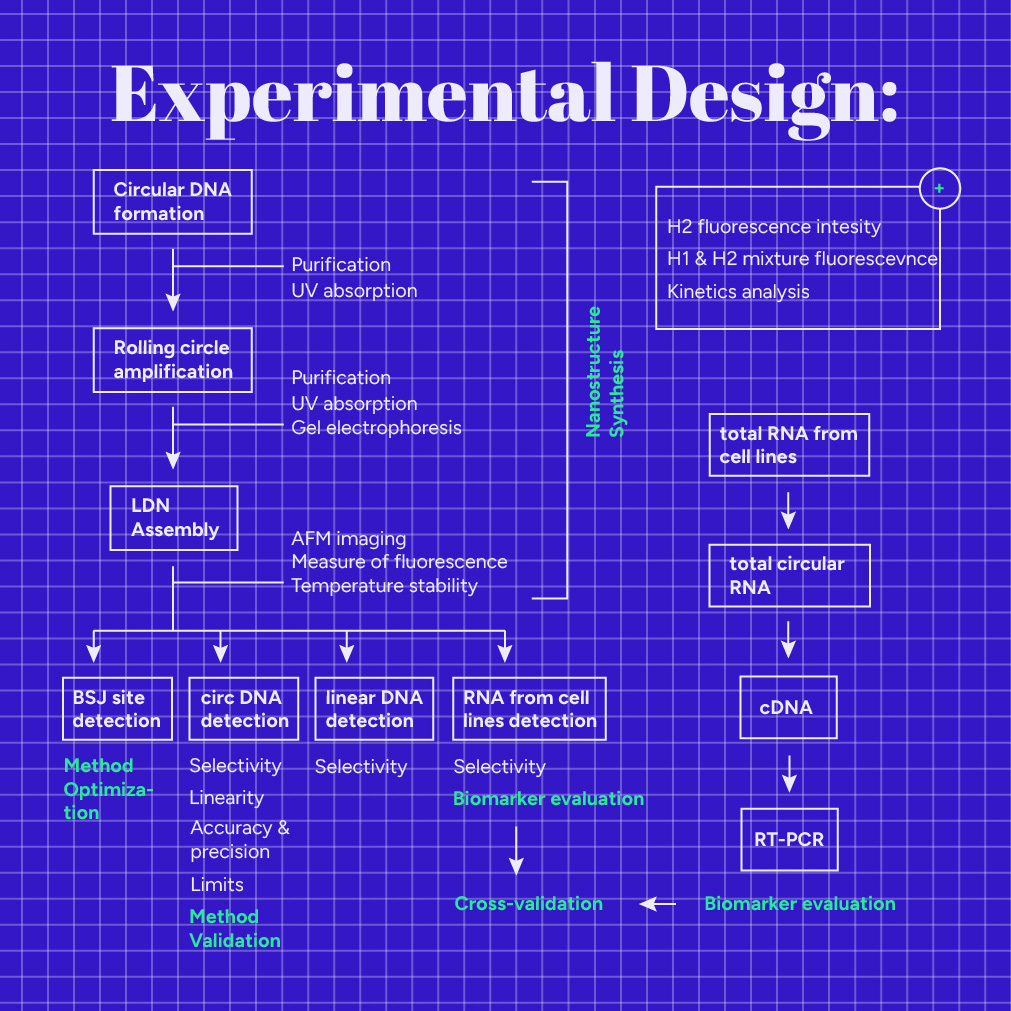
Our experimental design consists of three aspects: the Linear DNA Nanostructure (LDN) synthesis, our detection method validation, and the target evaluation to examine if it operates as the ideal diagnostic biomarker. Refer to the Protocols section for the exact reaction conditions used in each step of our experimental design.
Nanostructure Synthesis
We divided the DNA nanostructure synthesis into three steps. First, a phosphorylated DNA template's cyclization occurs (Fig.1) using T4 DNA ligase (M0202L) and a sequence specific primer (Note: this circular DNA is not our target). Next, we purified the circular product using Exonuclease I (M0293S), Exonuclease III (M0206S) and a PCR purification kit (740609.50). As a second step, we used phi29 DNA polymerase (M0269L), which possesses excellent strand displacement activity, to create a long linear DNA molecule. This process is also known as Rolling Circle Amplification (RCA), and the product consists of multiple repeats of the original DNA template sequence. We purified the RCA product using a PCR purification kit. In order to get a high yield of the RCA product, we repeated steps 1 and 2 multiple times, varying the conditions, until we ended up with the ideal ones (See Engineering Success Page). Finally, the Nanostructure assembly step (step 3) follows this process: multiple hairpin probes, H1 and H2, are installed to the DNA scaffold because one of their two "hanging tails" is complementary to the installation site. Of course, we repeated everything with different H1 and H2 specific sequences for each target.

In order to prove the feasibility of our design, we tested each step separately:
- We measured the circular DNA concentration by Implen NanoPhotometer® P330 using the oligonucleotide's unique analysis constant.
- We verified the long DNA scaffold preparation with agarose gel electrophoresis experiments. We have also scheduled Sanger sequencing to verify the RCA sequence.
- We tried to validate the LDN Assembly via Atomic Force Microscopy (AFM) imaging. However, we could not get a high-quality image due to the high salt concentration in the mixture.
Detection method
After our Nanostructure is assembled, we can use it to detect our target. Reaction mixtures are prepared using the Nanostructure, our target, and buffer solution. In the reaction mixture, H1 identifies the unique Backsplice Junction site of circRNA, triggering a non-enzymatic amplification reaction along the linear scaffold, and fluorescence emission.
In order to reach reliable results, our Bioanalytical method needs to be validated [1], [2]. We organized our experimental assays to output results to estimate the method's analytical performance.
Optimization of the method
We ordered a synthetic BSJ sequence for all three targets (hsa_circ_0070354, hsa_circ_0102533, hsa_circ_0005962) and used it as a model target for method development and optimization. To optimize our technique, we analyzed positive and negative samples in parallel. Positive samples contained a specific concentration of the synthetic BSJ sequence and our Nanostructure, while negative samples contained water instead of the target. Also, we prepared different target concentration samples by serial dilutions of a stock solution that were subsequently analyzed by the developed method.
Validation of the method
Next, the method was validated in terms of specificity, linearity, accuracy, precision, and sensitivity, using the complete circRNA sequence. For this purpose, we ordered the whole sequence for all three targets (hsa_circ_0070354, hsa_circ_0102533, hsa_circ_0005962) as a synthetic linear phosphorylated DNA sequence. Then, we produced the circular targets by cyclization of the phosphorylated DNA using T4 DNA ligase (M0202L) and a sequence specific primer. Next, we purified the circular product using Exonuclease I (M0293S), Exonuclease III (M0206S), and the PCR purification kit (740609.50). After the purification, we measured the circular DNA concentration using Implen NanoPhotometer® P330.
- Specificity: The method must detect the analyte of interest in a complex matrix in the presence of various components. Other components should not interfere with the analyte and should not affect the signal that a specific quantity of target gives out. In the ideal case, a mixture that does not contain the analyte must produce zero signal (or close to zero). Hence, we created positive and negative samples. Positive samples contained the circular DNA, in known concentrations, and our Nanostructure, while negative samples contained water instead of the target. We measured the fluorescence of these samples. We also tested the Nanostructure's ability to distinguish between circular and linear targets. So we created samples containing linear DNA (prior to the ligation reaction) and measured their fluorescence after incubation at the ideal conditions. It was also recommended to test the selectivity of our method using the degraded synthetic target, but we had neither enough time nor enough reagents.
- Calibration curve and linearity: We must investigate the relationship between the target concentration in the reaction and the fluorescence intensity. According to FDA guidelines, calibration curves should contain five or more calibration points. We created different target concentration samples through serial dilutions and set them for detection. The calibration curves contained more than five calibration points. Of course, we compared the calibration curves from this assay with the ones derived from the partial validation assay to see how partial validation deflects from full validation.
- Accuracy and precision: Accuracy describes the correctness of the experimental result regarding the actual concentration of the target in the sample. It requires the calculation of relative and absolute errors. Precision defines the reproducibility of the results between a central value for two or more repeated measurements. It is calculated by the coefficient of variance or standard deviation. To determine the precision of our method, we conducted each experiment in duplicates or triplicates.
- Sensitivity: Through the calibration curve, we can verify the sensitivity of our method, determining the limits of detection.
Cross-validation
Finally, we compared the method with the gold standard one, the reverse transcription PCR (RT-PCR). We used data from PCR and LDN reactions, as described below (biomarker evaluation), to cross-validate our method.
Biomarker evaluation
We adopted the following methods to establish the proposed method and to examine if our three circular RNA targets can serve as valuable biomarkers for lung cancer diagnosis.
Circular RNA expression in cell lines
We obtained the following lung cancer cell lines: A549 (CRM-CCL-185), H1299 (CRL-5803), DMS454 (CRL-2064), H460 (HTB-177), and H2347 (CRL-5942) from ATCC that account for Lung adenocarcinoma, Lung large cell carcinoma, Small Cell Lung Carcinoma, Large Cell Carcinoma, and Lung Adenocarcinoma Stage 1 subtypes, respectively. We also purchased a bronchial epithelium cell line derived from healthy human lung tissue, BEAS-2B (CRL-9609), as a normal control. First, we extracted the total RNA from the cell lines using the TRIzol™ Reagent (15596026). Then, we digested all linear RNAs using RNase R (ab286929). Next, we performed reverse transcription on circular RNAs to generate complementary DNA (cDNA). Finally, the cDNA was subjected to real-time Polymerase Chain Reaction (real-time PCR), using forward and reverse primers specific to each circular RNA target. In this way, we could get information on the expression of each target in the lung cancer cells compared to the normal epithelial cells.
Cell-line-derived target detection using LDN
Total RNA extracted from the cell lines was analyzed using LDN. We prepared both positive and negative samples. Positive samples contained a specific quantity of the total RNA extracted from the cell lines and our Nanostructure, while negative samples contained water instead of RNA. After incubation, we measured the emitted fluorescence. As we had validated our method using a synthetic circular DNA instead of RNA, we wanted to test the LDN's ability to detect circular RNA derived from cell lines.
Target stability
Samples of total RNA isolated from cell lines were frozen at -80 oC prior to RT-PCR. Also, samples were treated with RNase R prior to RT-PCR. Therefore, we ensured that targets have sufficient temperature and enzyme stability.
Ancillary experiments
H2 fluorescence intensity
We diluted the H2 hairpin probe at a final concentration equal to the concentration of H2 in the final reaction and measured the fluorescence intensity of the sample. In this way, we estimated the emitted fluorescence of the probe at a closed conformation.
H1 & H2 mixture fluorescence intensity
We mixed H1 & H2 hairpin probes at a final concentration equal to their concentration in the final reaction and measured the fluorescence intensity of the sample. Comparing these results with the fluorescence emitted by the closed conformation of H2 probe, we estimated the hybridization efficiency of the two probes in the reaction mixture in the absence of the target.
LDN's fluorescence intensity in the absence of the target
The negative samples (samples containing only LDN and water), prior to incubation step, were measured. In this way, we measured the fluorescence intensity emitted by the LDN alone.
LDN's stability
We constructed a calibration curve with increasing amounts of the BSJ target with LDN, that was previously stored at -80 oC, in order to assess the stability of LDN during time.
Time-response kinetics analysis
In order to find the optimal time of the final step of our method, we performed LDN detection reactions that were halted for consecutive times (0, 20 min, 40 min, 60 min, 80 min, 100 min and 120 min). Thus, the system's fluorescence enhancement with the time was determined.
Protocols
Notebook
Wet Lab Notebook
-
[1]. Tiwari, G., & Tiwari, R. (2010). Bioanalytical method validation: An updated review. Pharmaceutical Methods, 1(1), 25. https://doi.org/10.4103/2229-4708.72226
[2]. Moein, M. M., El Beqqali, A., & Abdel-Rehim, M. (2017, February). Bioanalytical method development and validation: Critical concepts and strategies. Journal of Chromatography B, 1043, 3–11. https://doi.org/10.1016/j.jchromb.2016.09.028